


|
|
||||
| Log In | ||||
|
| ||||
| ||||
| ||||
| ||||


Data Acquisition ![]() Overview
Overview
Monitor server and server room temperature, humidity
|
|||||||||||||||||||

IntroductionThere are a variety of threats to your server room. Some areas our equipment can help with are heat, water, fire, power failure and intrusion. Using a combination of built-in and optional external sensors you can monitor for problems and be alerted, by email for example, if there is an issue. View trends in graphs of historic data. The following overview is geared towards our WeatherGoose Series II units that share a common web interface and software features. The primary differences between units are the number and types of sensor inputs available. These units are standalone, so no client software is required. Just use a web browser to access the web interface. InterfaceThe heart of our climate monitors is the web server module. The web server provides the interface to the unit via a web browser. With the right configuration you can access your climate monitor anytime and anywhere you have Internet access. Through the web interface you can view the state of your gear, check graphs for trends and configure the unit. The interface is divided into pages that are accessed through a set of tabs. Here is a brief description of each: 
Sensors Tab - Shows sensor values for each device along with a graph [View Screenshot] Sensors: View sensor readings and graphs Alarms: Add/Edit/Remove alarm thresholds and alerts recipients Logging: Download log data and display custom graphs Display: Modify interface settings and edit friendly names Config: Configure network and service options such as email and SNMP SensorsOur climate monitors use a variety of sensors to collect environmental data for your server room. Each unit has some number of built-in sensors. These range from just a temperature sensor to units that can also monitor humidity, airflow, light and sound. Some include an outlet strip for power monitoring. Along with built-in sensors most units have connections for external remote sensors. These allow you to monitor areas distant from the unit. There are two kinds of remote sensors: analog and digital. 
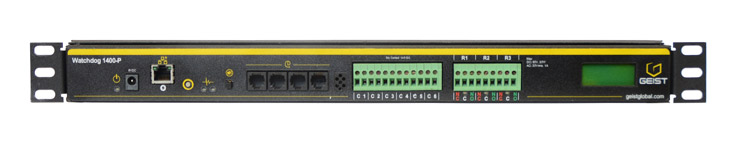
Typical monitoring setup - Rackmount unit with remote digital temperature sensors, analog water sensor and IP webcam Analog sensors connect to the analog input ports. The analog inputs will accept a dry contact or a proportional 0 to 5VDC signal. Some examples are water detection, door contact and smoke alarms. Digital sensors communicate with a climate monitor through a serial protocol. These sensors connect to digital sensor bus ports on the unit. A unit can support up to 16 digital sensors. Splitters can be used to expand the number of ports. Examples include remote temperature and humidity sensors. LoggingThe ITWatchdogs WxGoos Series II logs sensor data to onboard Flash memory. This data is stored in the unit until it runs out of space. When this happens the oldest data is overwritten by the new sensor readings. The units will indicate how much it can store before overwriting old data with new. The log data can be downloaded as a CSV file through the web interface. 
Logging Tab - Get graphs based on the sensors and over the time range you select [View Screenshot] GraphsGraphs are generated from logged data. These are useful for seeing trends and making comparisons between sensors. The Sensors webpage has graphs covering the full time range available. On the Logs page you can select the sensors and time range of the graphs. AlarmsYou need to be alerted if there is a problem with your gear. Alarm thresholds allow you to set the acceptable range of values for your sensors. Then you chose who should be alerted if there's a problem and the method (Email, SNMP Trap, and/or Buzzer). 
Alarm Tab - Alarm thresholds are configured to send alerts if a problem occurs [View Screenshot] Escalating or multi-level alarms are accomplished by creating multiple thresholds for a particular sensor. FirmwareWe periodically release new software (firmware) for our climate monitors. These updates can include new features, improvements to current ones, or bug fixes. New firmware can be downloaded from our website when released. Then the file is uploaded through the web interface. Access ControlUp to three access level accounts are available. These are set through the web interface. The WxGoos Series II supports HTTPS so you can make an encrypted connection to a unit. It's possible to change port numbers of various services and block those you don't want used. Protocols SupportedHTTP, HTTPS, DHCP, DNS, NTP, Syslog, SNMP (v1, v2c, v3), TELNET, XML, Ping, SMTP (ESMTP Auth, POP3 Auth, SSL/TLS)
View the different Monitors we have here....
|
_anim.gif)